From cycling to computer systems performance – Part 1
- A foreword
- Cycling
- Through a garden
- Models
- By a few centimeters
- Further simplifications.
- What has all this to do with computer performance problems?
- The way you measure matters
- Conclusion
This is my first longer blog entry after getting back to a more frequent blogging schedule. It will be a two part blog entry. It may start with cycling, however it’s more about measuring, about interpreting data and how you thought model of the situation can lead you to wrong interpretations. But that is mostly in the second part.
A foreword
I got that explorer tile (I will explain later what this is). I just went there again a few days later to collect some of the explorer tiles west of the explorer tile that is central in this part and thus collect the missing tile then. If you are interested about some thoughts on collecting data for performance problems, you may should jump to the section “What has all this to do with performance problems?”
For quite a time i searched for a good example for something that I’m discussing quite frequently with customers and friends: How does measuring influences your way to perceive reality and thus react to it.
It took me a while before i recognized that I’m sitting on a large heap of data to demonstrate some of the effects I’m seeing as well when troubleshooting computer performance problem. And why shouldn’t they appear there as well. It’s at the end about measuring things. For these observations it doesn’t matter if it’s about GPS coordinates or writes per seconds on a disk.
Cycling
As you may know I’m motivating myself to ride large distances by a little gamification (besides the gratification effect when you are standing on the scale and hope you have shaved off some weight). In my case it’s collecting the explore tiles on Statshunter or Veloviewer.
Explore tiles are the squares in a square grid when your divide the earth surface in equal sides squares. You collect one by driving or walking into this tile. There are roughly 238 million all over the world. This summer I made a longer ride to Amelinghausen, a larger village some kilometers away from Lüneburg. It’s in the middle of the Lüneburg Heath and perhaps most known for electing a heath queen once a year, one of them was Jenny Elvers, a celebrity rather not at the top of the alphabet today, and honestly not back in her days. But that’s only my opinion. But you couldn’t evade reporting about her for a while. For me this village is more a nuisance because it’s on the way to the A7 when I’m heading to the south and I must drive 50 kph through this village.
That said, I “collect” those tiles and sometimes I even plan my tours to snatch a tile. This is the reason why my tours look on Strava sometimes like I’m lost.1 I’m not lost in such moments. It’s just the the problem that some streets getting from great tarmac easy to ride with a road bike to roughest terrain within a kilometer or two, not suitable to pass with a road bike and sometimes even not with a gravel bike. And so, you have cycle back and try another street to snatch another explorer tile, even when the map looked reasonable.
No, those as planned detours to fetch such a tile. Some of them really need planning because not all of them are easily reachable. Usually, I’m planing those routes with Komoot or Strava the evening before, export them to my bike computer and just ride them a day later. And the bike tour I’m talking about in this blog entry was such a preplanned tour.
It’s sometimes a little bit hard to find a way to a tile where you don’t have to push your bike. And there is probably a large block of tiles southwest of Lueneburg that I will probably never collect. There are large training grounds for the military there … and I don’t want to ride there obviously as my bicycle isn’t resistant to unexploded ordinance.
What follows now is totally overanalyzing the data. I know this ;) But digging deep into a problem to find out what really happens is not only something i like to do in my job. Other people are doing crosswords or Sudoku to keep their brains running. I’m put my teeth in problems like this and try to get some insight out of it.
I should say that I’m quite a data-centric rider. My performance on a bike normally wouldn’t warrant this level of data recording, but out of health reason i adhere to a somewhat strict torque and power limit when cycling. So, i have to measure the data and the devices records them. Why should i throw this data away? The reason is nothing that hinders me otherwise, i should just not put 800 Watts into the pedals. That said, I’m a long-distance rider in a flat area, no need for such power levels anyway.
Through a garden
That said, in the summer I came back from a longer tour. I uploaded my GPS track into Strava (or to be exact my Garmin Edge 830 bike computer did this for me automatically as soon as i tell the computer to stop recording) and then checked Veloviewer for new tiles i was able to collect. And I was a little bit puzzled. I found out by looking at the map that I didn’t collect a tile that I should have collected according to my pre-ride planning.
And indeed, on higher zooms level: It looked like was on the border and so technically I didn’t enter it with the current algorithm used by Veloviewer and Statscounter. 2
I zoomed in and thought : “WTF?”
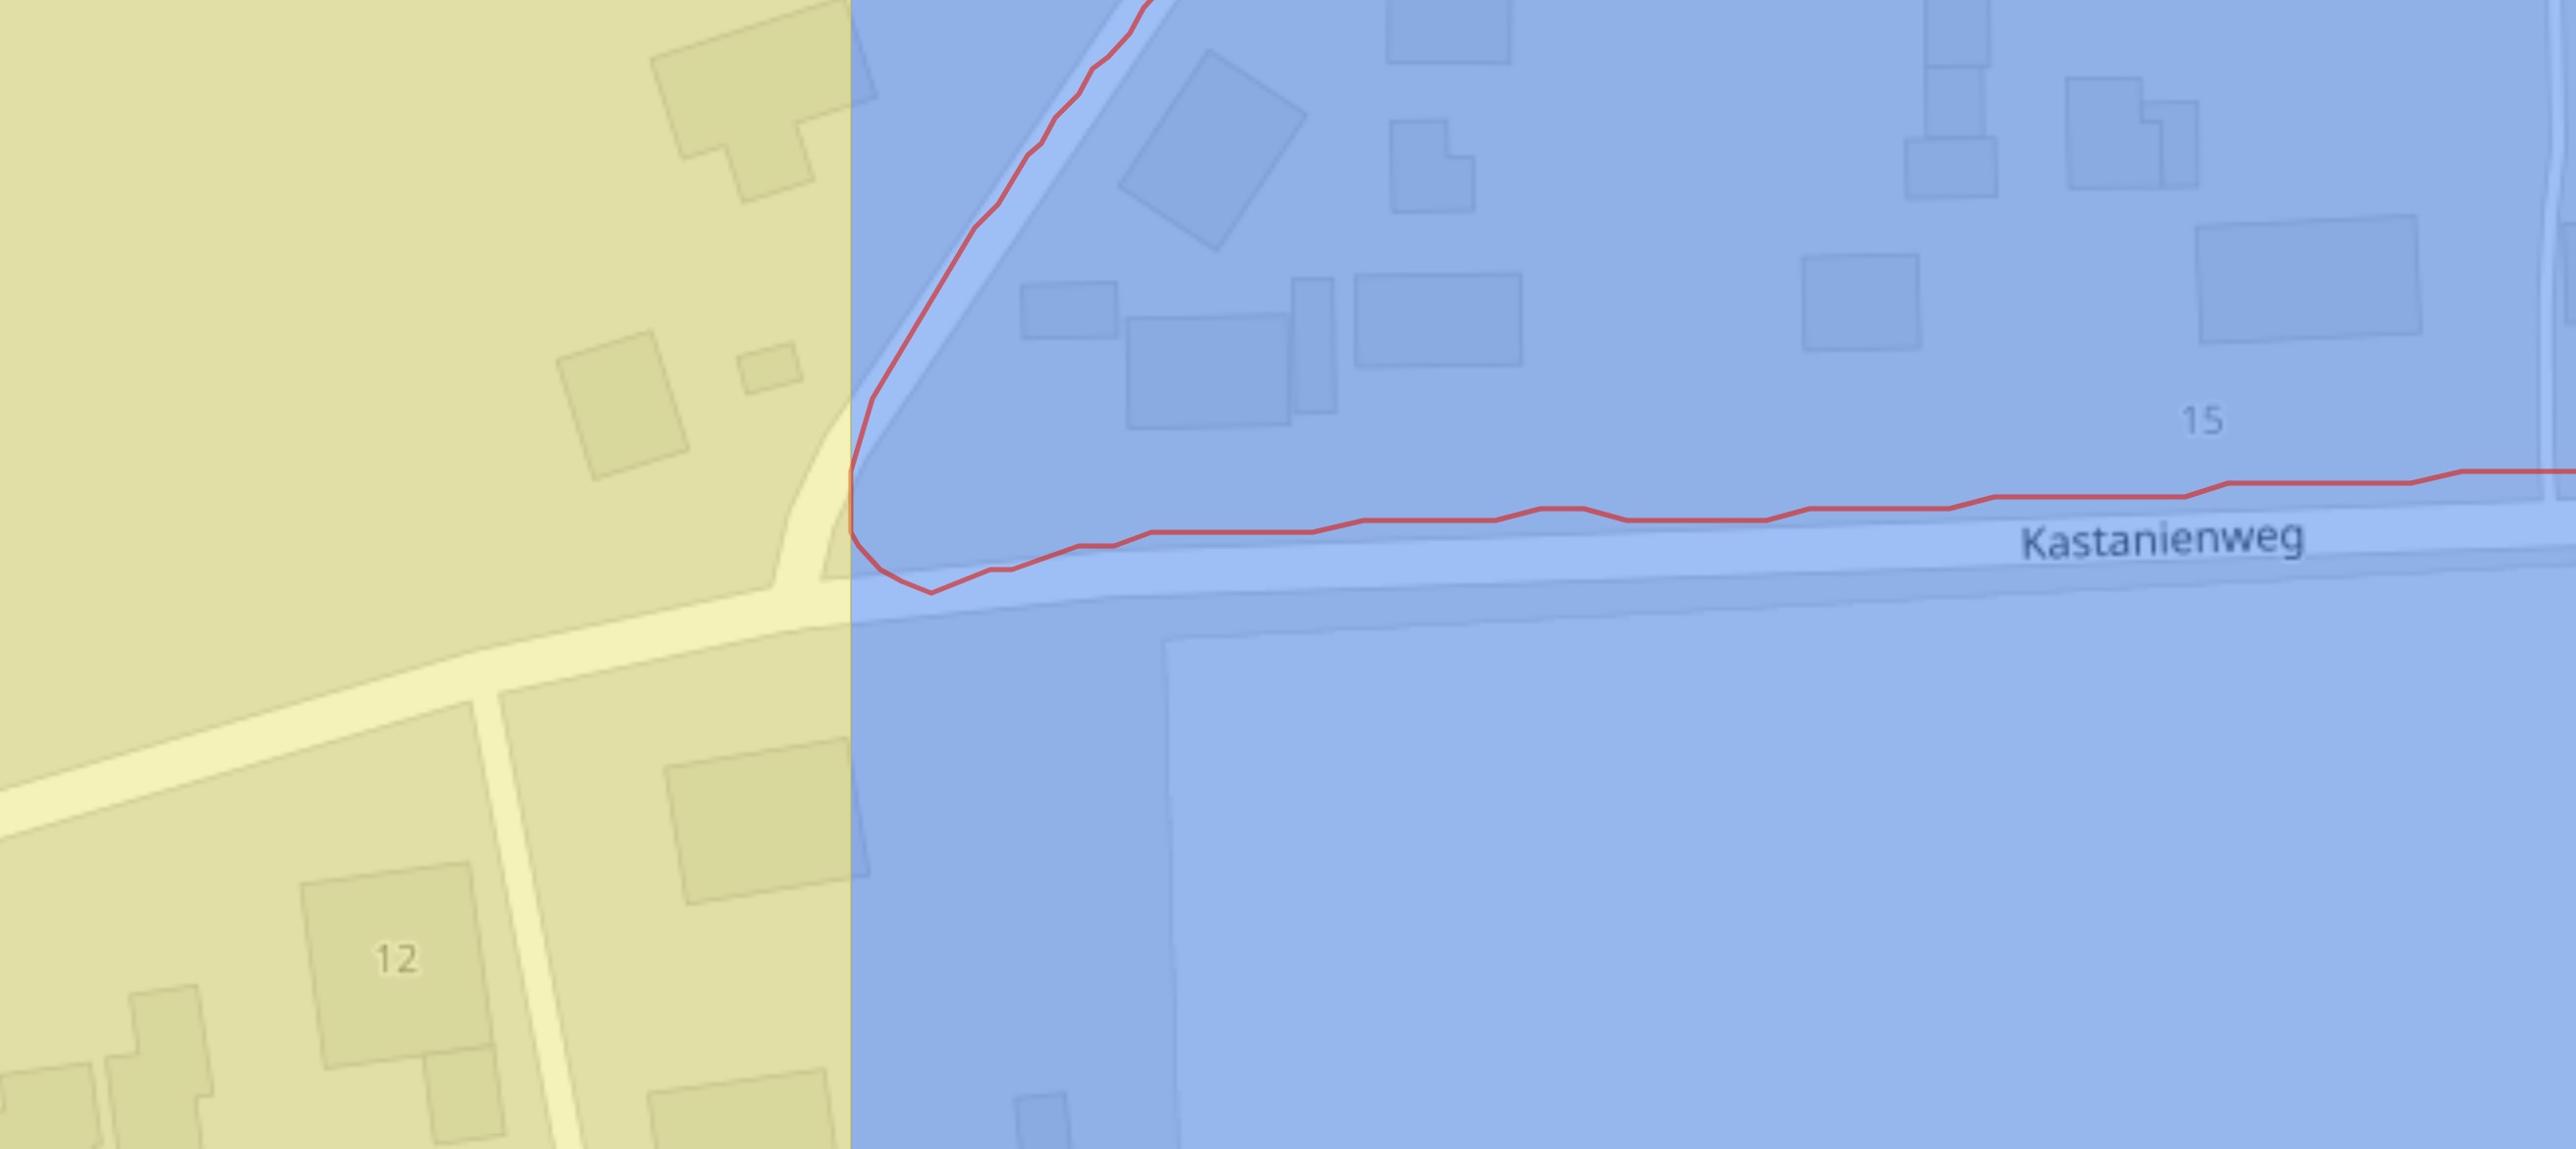
The blue part is a tile that i was able to collect. The yellow part is the tile, which i wasn’t able to collect. I whould have collected it, because the street would have led me into the uncollected tile.
I was pretty sure; I didn’t ride through the garden of those people and the intersection is clearly in the non-acquired tile. Despite my often repeated dogma „If you hears hoofs, don’t think about zebras“, I thought about a lot of zebras, thought about errors in the map, for example that the intersection is not at the right place in the map. Or that my measuring equipment (aka GPS) isn’t measuring correctly. I found slight errors in maps in the past by cycling and I know about the imperfections of getting a location via GPS.
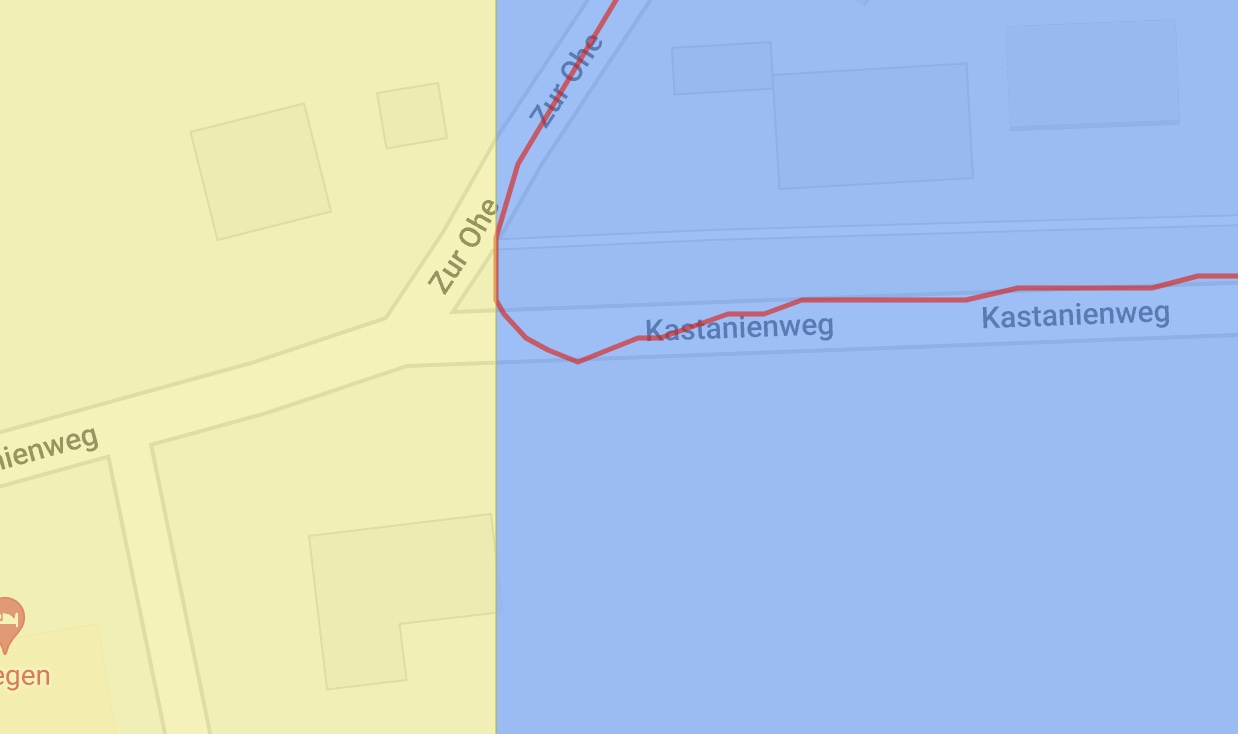
But the intersection was at the same coordinates on Openstreetmap (which is the map data used by many sports related websites) as on Google Maps. And why should my Garmin Edge would correctly place me on the correct side of the street but then place me in the garden of some unsuspecting people in the Lüneburg Heath? Didn’t really made sense.
Did i just rode through the vegetable garden of someone and didn’t recognize it. This would for sure be a new step ahead in being an annoying cyclist in comparison of being part of a MAMIL group ride. 3
Models
It took me a moment and a big facepalm to find out what’s was really the problem. I made the wrong assumption that the model I’m looking at equals the reality. Models of the reality - and maps are models - are not the reality. They always simplify the reality to some degree to make them fit for use.
For cycling and running you don’t need a map with extreme precision. To navigate you don’t need an exact model of the streets, houses, gardens, and property boundaries. You don’t even need it that precise for self-driving cars, i think. Because at the end you don’t let the car steer itself like you would fly an aircraft with instrument flight rules. You should have something like an LIDAR to know what actually your surroundings are and the system should base it’s decision on this currently measured model of reality and not the one on the map, where won’t find other cars or the newly constructed bike lane.
You need that level of model of the reality when you want to argue with your neighbor who owns a tree. When you want to construct a street. But for navigation on streets, you can use a simplified model.
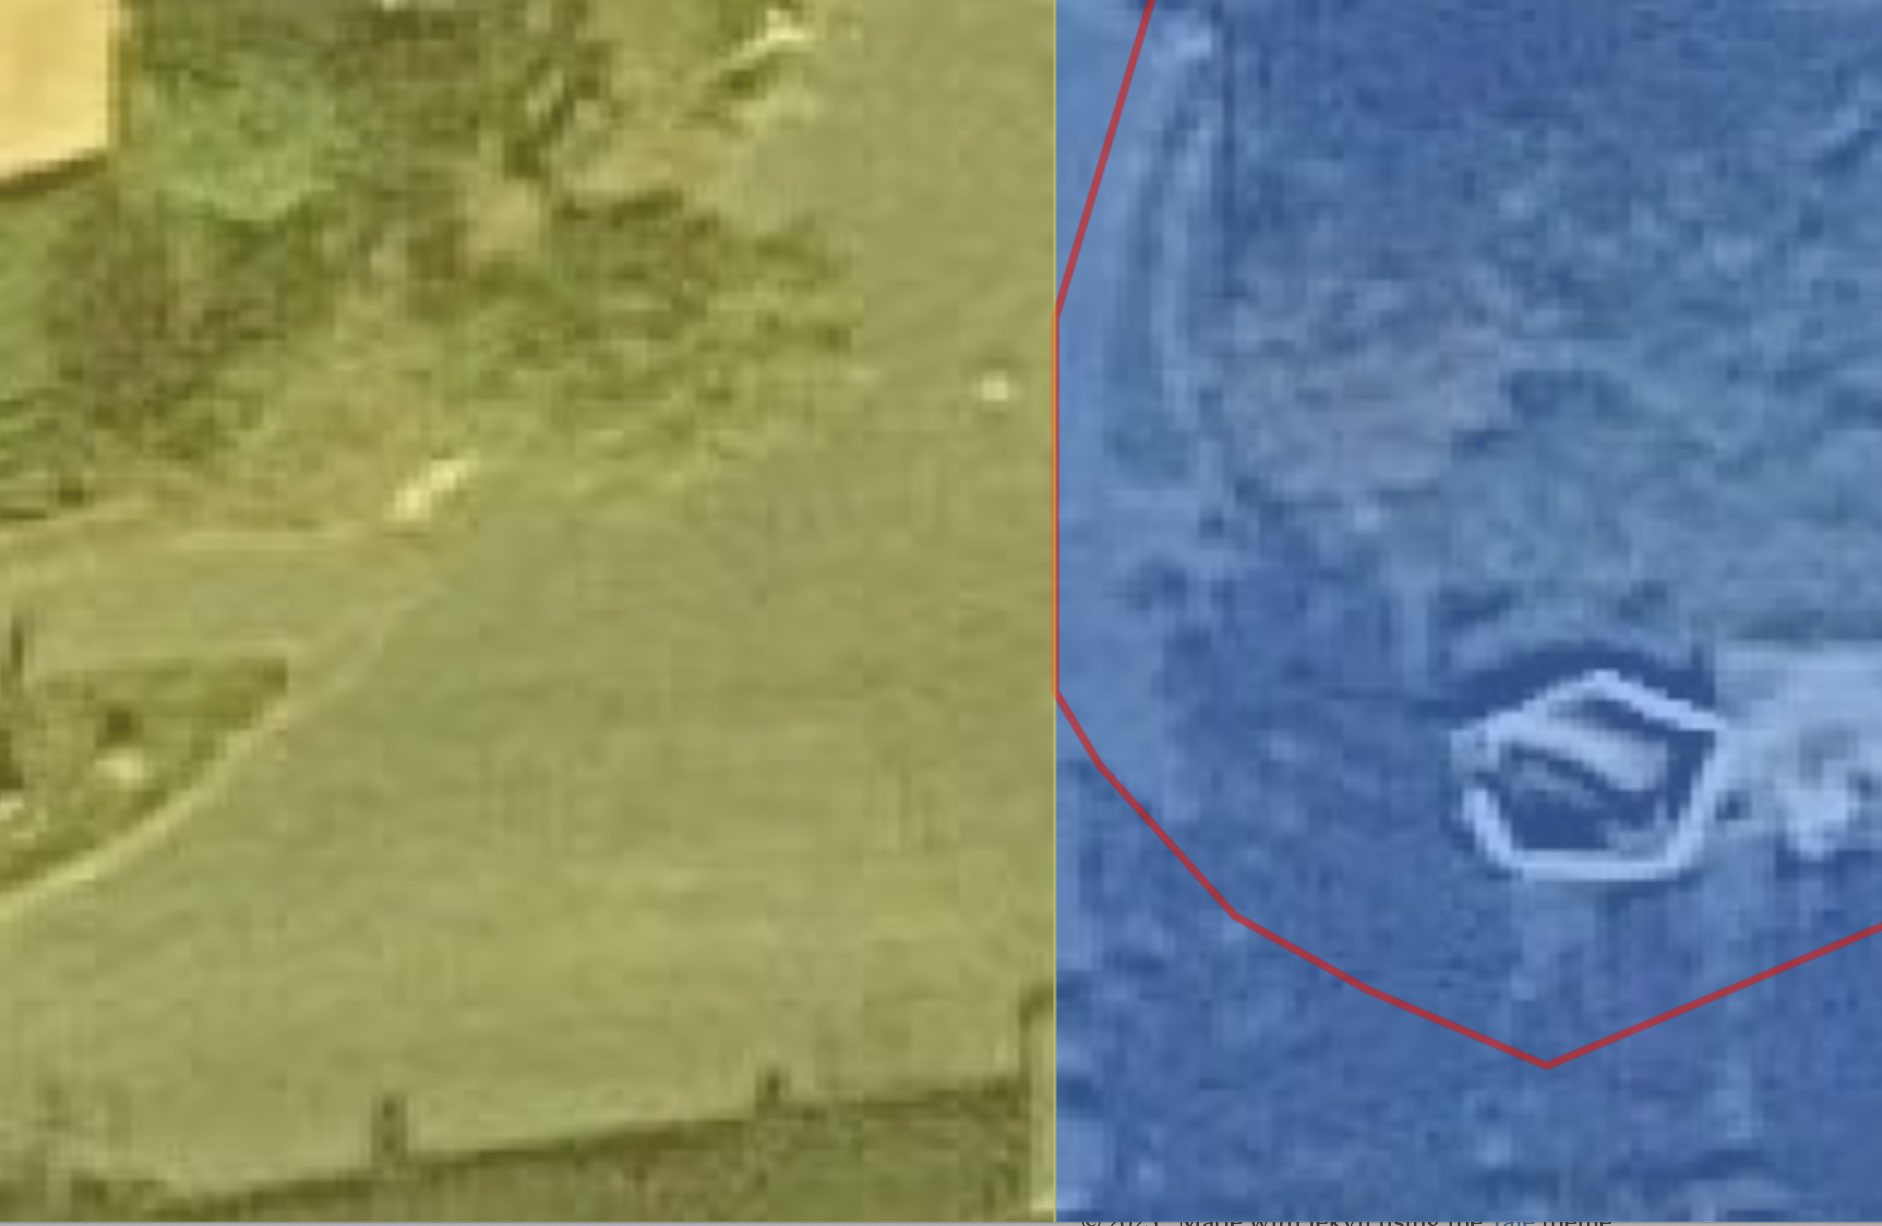
The issue was clear when I switched to satellite view. By looking at the map, my incorrect assumption was clear: That one street intersected relatively sharp into the other. Like on the map. But that’s nonsense when you think about it. Many streets, especially when they are not joining at a 90-degree angle have wider junctions to ease turning. That’s obvious and it’s worth quite a facepalm not to have thought directly about this. The street didn’t forced me into the tile. Only the street on the map did so.
The junction was rounded and thus while I was seemingly driving though the garden of someone in the model “map” I was still on the street in the reality. And on the satellite view, which is still a simplification of the world (for example it’s the 2D transformation of a 3D world), it was perfectly clear. It made sense that I didn’t enter the tile, when the map model suggested that I would be forced by the street into the next tile.
It was possible to miss the tile without entering the private property of someone. Something that looked impossible when looking on the map. This is the track superimposed on a Google Maps satellite view:
By a few centimeters
Okay, so at least I knew at that moment the recorded track didn’t put me in the garden of an innocent stranger. But then there is another question: By what margin did I miss the tile. It got strange here. I don’t exactly know where the borders of the tiles in Veloviewer or Statshunter are. That’s the problem. I don’t know what the algorithm of both websites considers as “entering a tile”. Totally crossing it? Intersecting with it? Crossing it and them something? Like for example at least 0.01 degrees? I really don’t know.
I found out that, in some tools - if you export the non-entered tiles (for example as a map overlay for your Garmin bicycle computer) - the eastward border of the missed tile is at 10,17334 East. However, the most westward point in the tracking data of my bicycle ride was 10,173338 East. So, I indeed entered the tile. By a margin of 0.000002 degrees.
How much is this in a more practical unit of measure: Since my education I never used spherical trigonometry (to be honest: I didn’t used trigonometry at all since then). I’ve used a lot of statistical methods in my career. So i cheated: I just put them into a fake track in my gps editor (to ensure that calculation errors are the same), both points on the same latitude and asked for the length of this track. Well, the distance between both points is humongous. It’s 13.3 cm.
The algorithms at all the websites I know (there are more than Veloviewer and Stathunter) denied me the tile.
Further simplifications.
I may have even been further in the tile. I’m pretty sure that I’ve entered the tile. There is another model at work here that simplifies the reality. My Garmin Edge is sampling my tours in 1 second intervals to track them. With a sampling interval of 0.5 seconds the device could have tracked me at a different point on my route, perhaps “decisive” additional 1 cm to the left …
Or if I started the GPS device half a second later or earlier back in Luneburg the sampling would have taken place in the other tile. The GPS track inside the device is at the end not the real tour. It’s an extremely close approximation of the tour based on coordinates it has received.
The GPS track is just a set of over 12000 points. It’s a digital sampling of the analog signal that that my cycle tour at the end was.
I’m pretty sure that I didn’t drove a perfectly straight lines between all the points especially when turning. Real bicycle tours have curves, especially when you climb up a relatively steep ascent 4 . They are not a collection of straight lines.
When you go back to the satellite view with it’s higher zoom level you see this straight line. But this is not the way you ride.
And when you want to go down this rabbit hole: The device doesn’t sample my tour through the world, it doesn’t sample the way of the bicycle trough the world. The Garmin Edge as my measuring device just samples its own way through the world and it’s much smaller than my bike or me.
However, it is a good approximation and a sensible simplification of reality, as for all practical purposes and within the limits of the precision of the measuring device there is no useful difference if you are measuring the location of my body or the measuring device.
But when you really think about: My shoulders are wider than 13.3 cm to both sides. So at least my shoulder must have entered the missing tile, even if the GPS device measured a longitude perfectly sitting on the border of the tile.
So, by all practical purposes I entered the tile. But it isn’t the data and/or interpreted as entering the tile. And thus, it didn’t happen. I could modify the gps track and moving the data point by 13.3 cm … or two or 10 meters.. But that’s a slippery road. When you start to change data of your recordings, what prevents you to do larger modifications.
What has all this to do with computer performance problems?
Of course, you may ask “What the heck has this all to do with hunting down performance problems on computers?”.
On one side, cycling empties my brain enough to find new thoughts. I found more than one root cause for a performance problem while sitting on a bike. I guarantee, you will get at the point in performance troubleshooting where you are just mentally stuck. Anything that gets your brain away from the problem will help you in the situation to unstick your thoughts. But then I could just write about “Hey, buy a bike, go cycling when you are mentally stuck. It helps”.
But it’s more. Most of the effect you have seen above are valid as well when measuring the performance metrics of your system. I think there are universally valid when you are measuring something.
One should be aware of all the limitations of the tools you are using to measure. I think one of the “limitations” is that the state of your system will always change in faster than your measuring interval is. You should get reports out of your toolset that have a meaningful time interval they are covering. Meaningful in the sense that they sufficiently describe your system, because perfection in describing your system is unattainable. And thats where certain considerations matter.
The way you measure matters
Quite often questions about a performance problem starts by looking remotely onto the problem by looking at reports or data of the system. For example, a friend is sending me some data like “have you seen something like that?”. Or a customer of the company I’m working for wants to have an opinion. In such cases i depend on reports and collection of *stat-command outputs.
I sometimes get database workload reports with a coverage of a day of so in a single report. However this would be like setting my bicycle computer to a mode where it just records one GPS coordinate per hour. Because: The effects on measuring intervals are interesting and significant. I’m pretty sure you know this already.
I want to show these effects with some example tracks from this ride. They represent the effect quite nicely. They are all about absolutely the same bike ride, they are just processed differently after the ride for this blog entry. They stem from the same dataset.
At first an explanation: I’ve set my Garmin cycling computer to store all measured data once a second. I set it that way right after the blog dcrainmaker suggested in his review of the Garmin Edge 830 when I was out for shopping a bicycle computer. It stores data like my power output measured by a pedal power meter, heart rate by a Garmin watch, coordinates by GPS obviously, speed is calculated through the GPS differences when my wheel rotation sensor is out of batteries otherwise by a sensor measuring wheel revolutions. So, you create a lot of data when riding. There are other modes like some kind of smart recording interval that seems to decide on its own when it’s worth to store a data point. But I don’t use it.
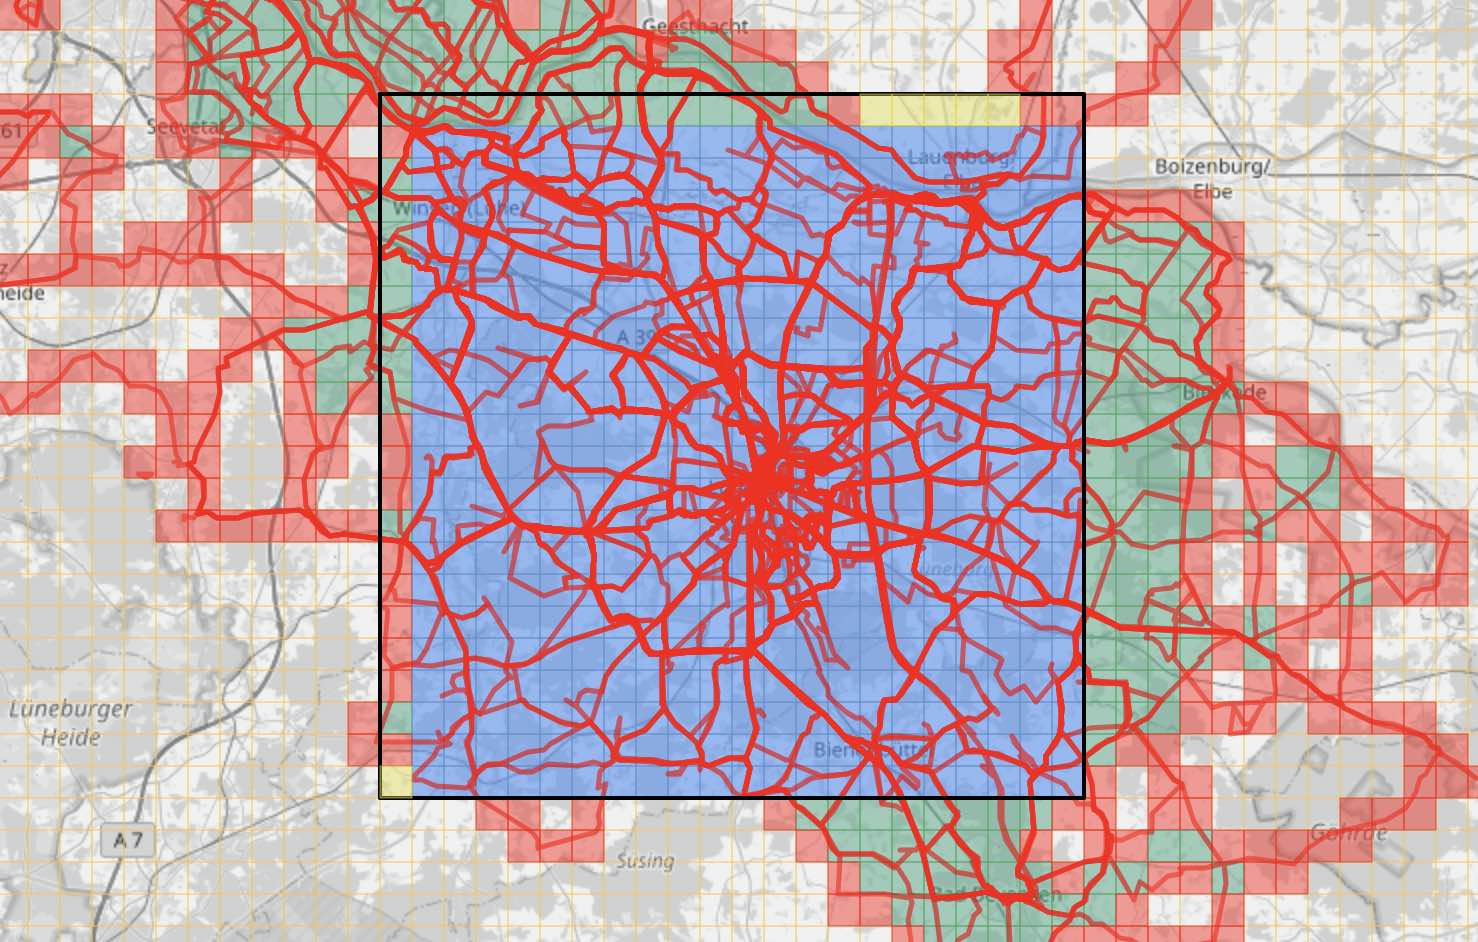
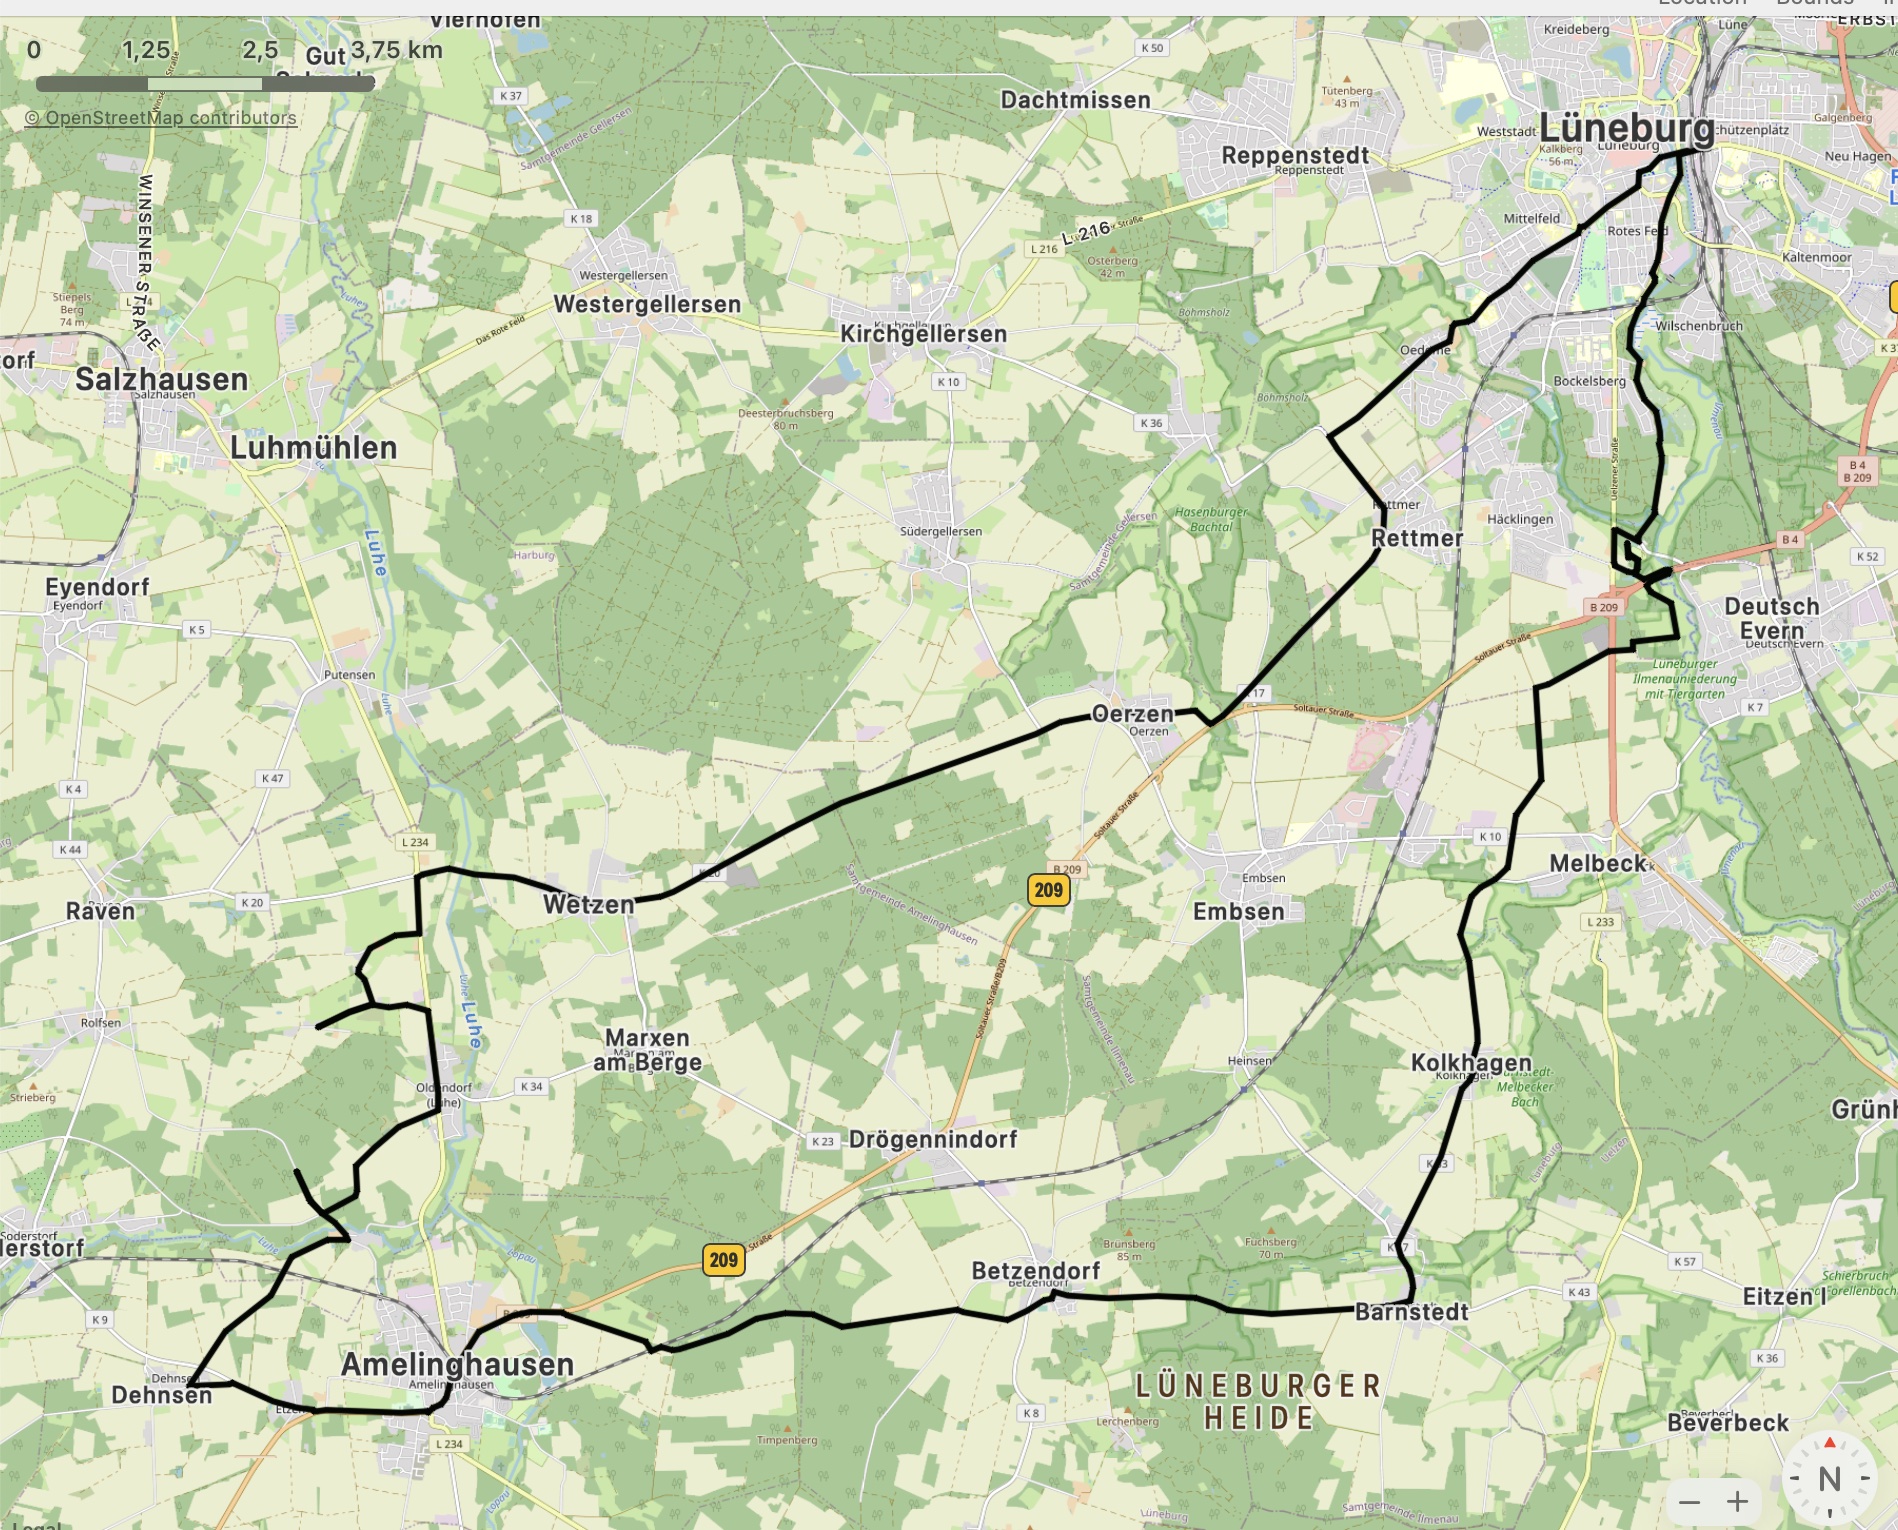
At first i would like to show you the raw data. All measurements in regard of the coordinates. The first map is the full tour with over 12.000 track points. You can nicely see every detour. Every street I’m using. If you zoom into the track, you can even see which side of the road I have used.
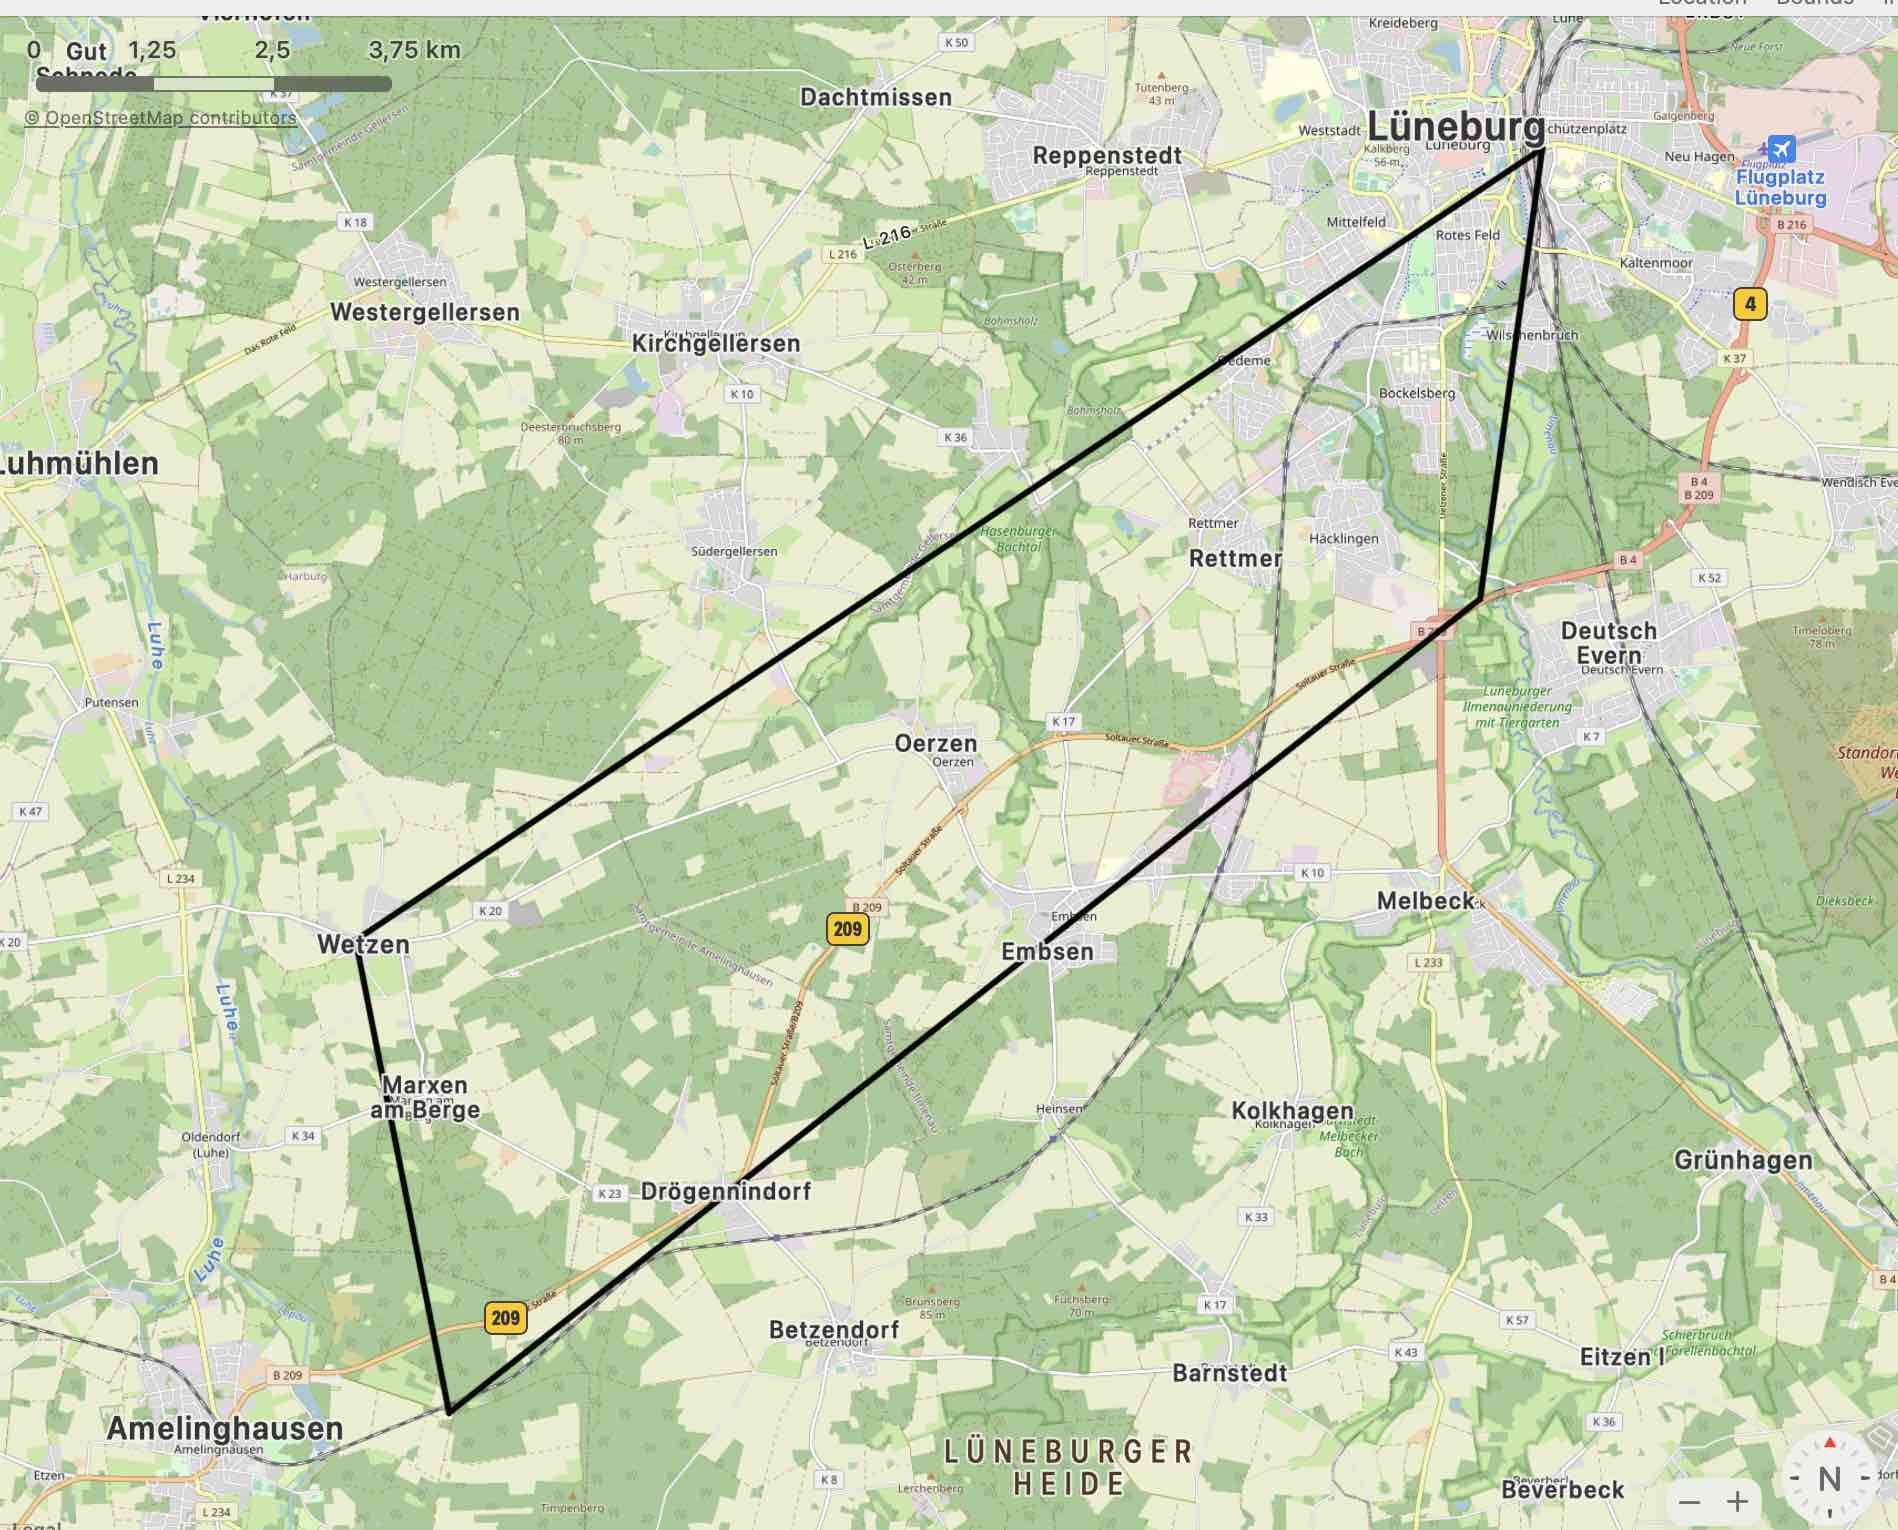
For the second one I’ve reduced the track the start and the end of the ride plus a measurement each full hour of the day. (6:30 AM, 7:00AM, 8:AM and so on) to simulate such a measurement.
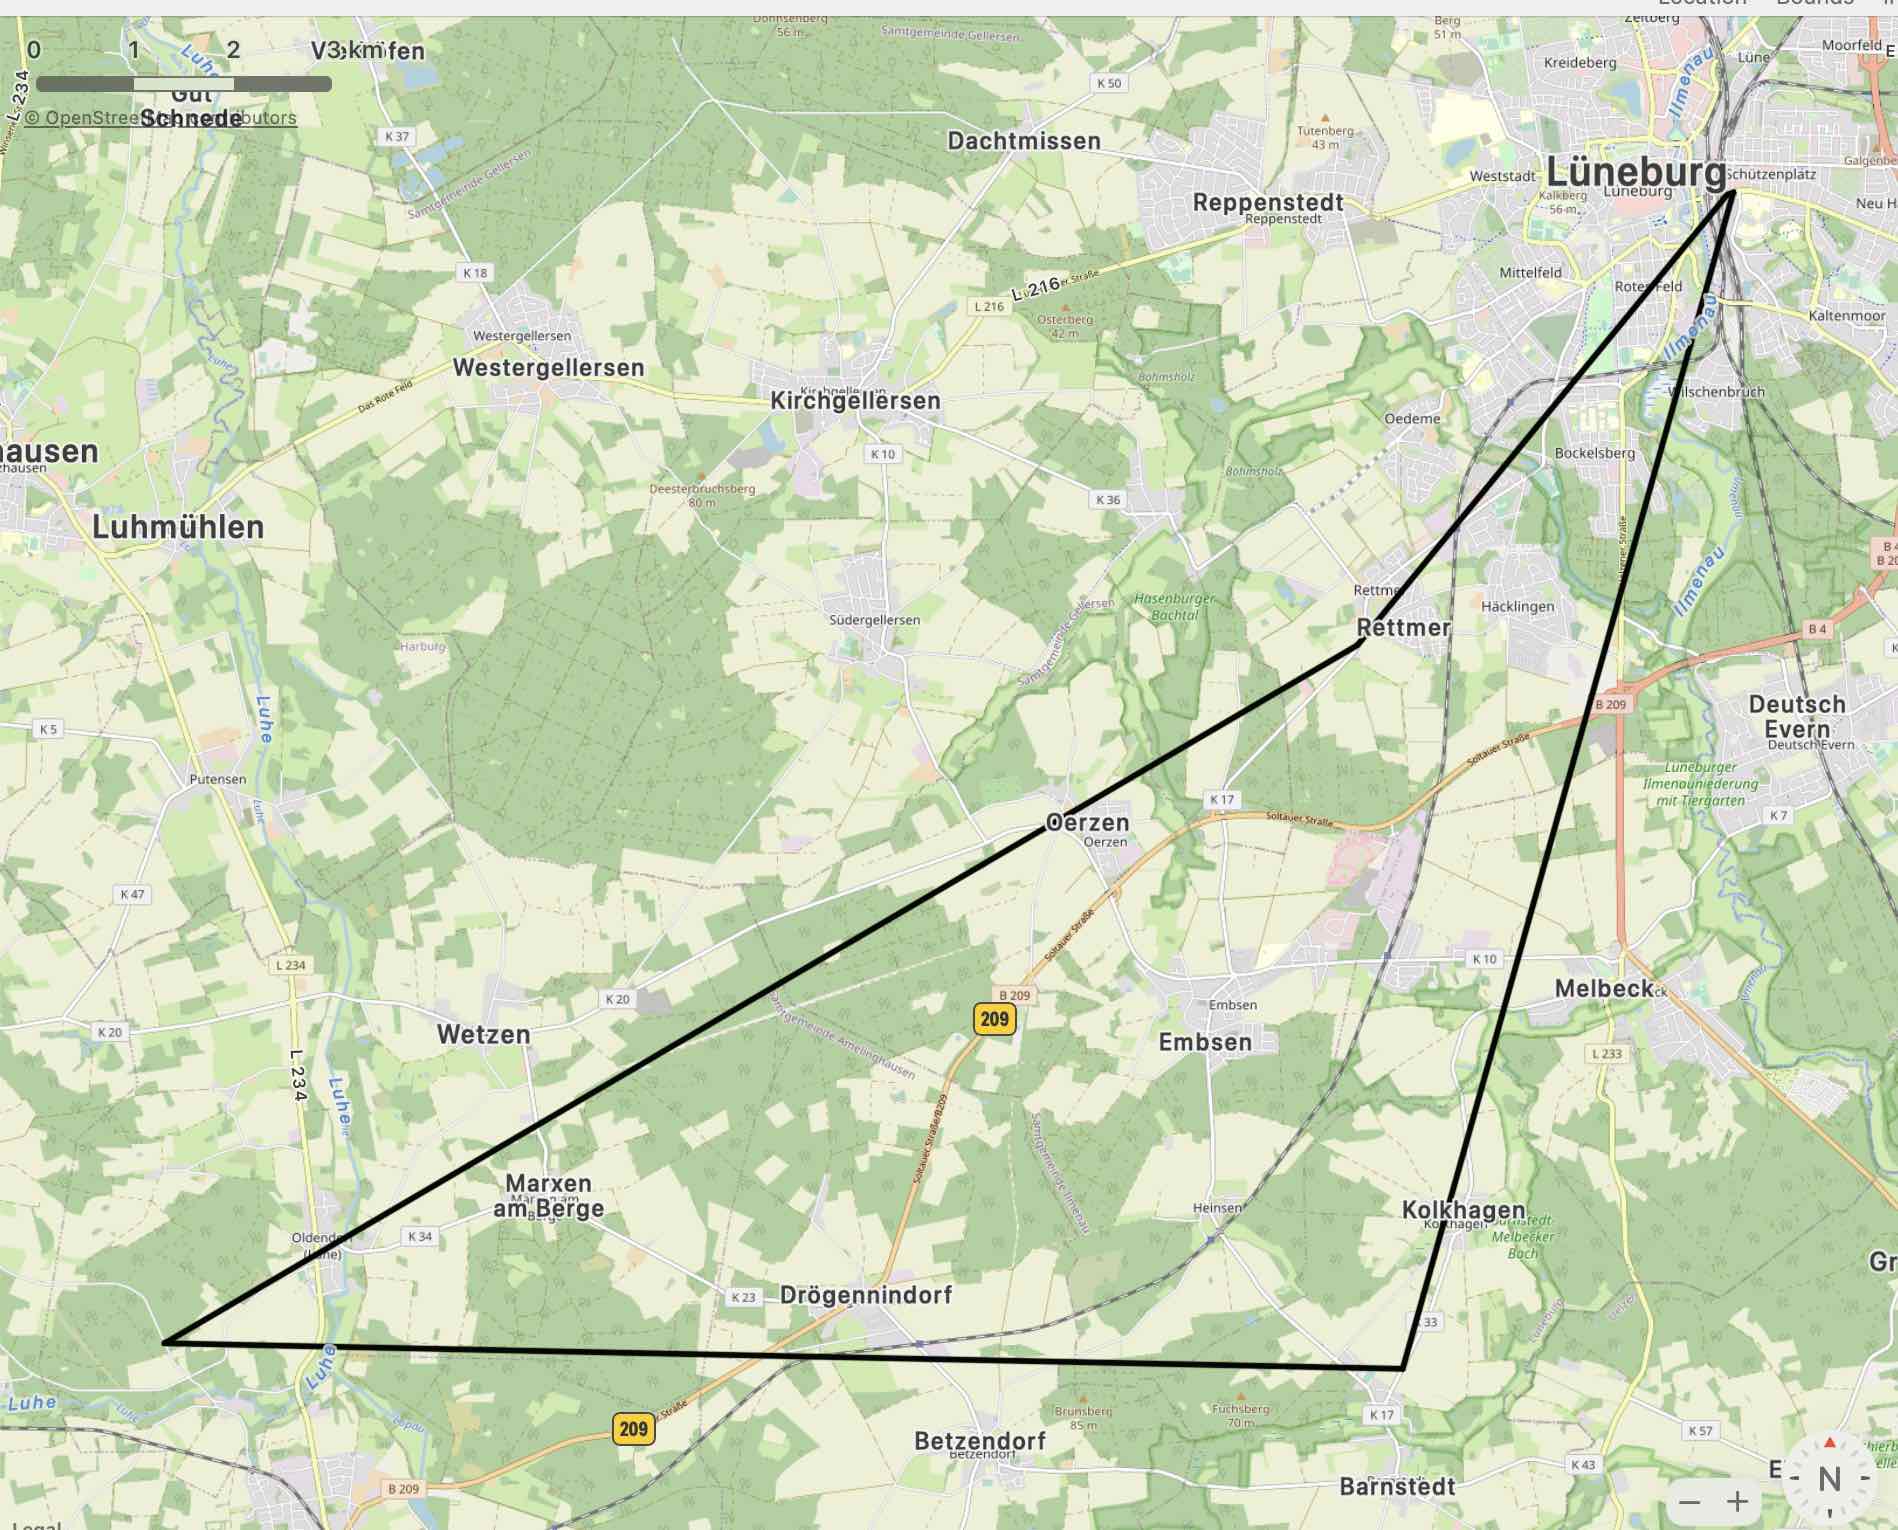
The third one is reduced to the start and the end plus a measurement every full hour elapsed after start (06:30,7:305,8:30 and so on)
So, with the reduced dataset you see the general direction of the bike tour, but based on the data you could not find out that I was in Amelinghausen, you wouldn’t know that I stopped at a bus stop in Wetzen to lube the chain and I wasn’t near the location of my “explorer tile problem” described above.
Just to give you another example about the effects how you are measureing . If you measure the ride with one measurement every 1h elapsed the ride was 39.1 km, if you measure at each full hour of the day, the distance between all the points is 45,4 km, if you measure in 1 second intervals it’s 64.1 km.
Conclusion
The decision how often and when you measure is quite significant for the dataset you get and thus for the analysis you do. Based on this is may even change the model about the workload of the system you have in your head. . But this blog entry is already long enough. The next part will be more about systems performance and less about cycling. It will be about averages, it will be about if you are missing something.
-
I recently removed public access to my activities on Strava. So you have to believe me, that I looked like I was lost. ↩
-
Well, you could argue: Can you be “on a border”? How thick is a border? If a border is a line, it’s one dimensional, it has no width, so as a three dimensional being you can never be completely on a border, it always intersects you. I think you need to be a point to be on a border. And a line has no height. So, when you assume a border is a line on the ground, the border doesn’t intersect you, you are touching the border. Isn’t a border more a two-dimensional construct perpendicular to the earth crust with a certain part above the earth crust and another part below the earth crust with no width. I forgot what’s the point of this line of thought, can’t figure it out at the moment. I will stop this thought, before someone drives a stake perpendicular though my body to intersect with my heart or brain. Back to the topic. ↩
-
Never did a group ride, I prefer to cycle alone. I like to take photos while riding. I hate the competitiveness that seems to automatically appear when you ride in a group. But i have to admit that i was wearing Lycra in public for a while. Guilty as charged. Just not in neon colors but in black. ↩
-
Okay, steep for Northern Germany. I saw some ascents in the Saarland or Rhineland Palatinate which really deserve the name steep ↩
-
Actually a little bit later, because at 7:30 AM sharp I was sitting at a bus stop in Wetzen lubing the chain as it sounded in a very,very annoying and horrible way. ↩